
[vc_row full_width=”stretch_row_content_no_spaces” content_placement=”top”][vc_column width=”1/3″] What is Bioregional Mapping?[/vc_column][vc_column width=”1/3″] Bioregional Mapping Why It Matters[/vc_column][vc_column width=”1/3″] Tools of Resistance Indigenous Mapping[/vc_column][/vc_row][vc_row][vc_column][vc_empty_space][vc_separator][/vc_column][/vc_row][vc_row][vc_column width=”1/4″][vc_widget_sidebar sidebar_id=”pojo-sidebar-76″][/vc_column][vc_column width=”1/2″][vc_column_text]
How to Map a Bioregion
Welcome! The goal of this worksheet is to provide an easy and simple way to help people map their bioregion. Bioregions have a defined political, economic and spatial territory, through natural boundaries and borders, and those living there.
Below are some simple steps and layers that might be useful. We recommend that you start by defining the area you want to map, find your layers, usually starting from the hard lines, working your way down through the soft, finishing with human cultures and geography. And lastly, to find the emergencies and correlations which can help guide activities, recommendations and ways of living.
There can be many different determinants, ideas and definitions for what a bioregion is or isn’t – but above all else – below are three simple checkboxes that a bioregion must pass in order for it to be a bioregion.
- A bioregion is a land and water territory whose limits are defined by the geographical limits of human communities and ecological systems rather than by political boundaries.
- Such an area must be large enough to be able to be self-reliant and be able to maintain the integrity of its biological communities, habitats, and ecosystems.
- People Matter. Ultimately it is up to the people and inhabitants of a bioregion to determine what best represents them, their way of life and living. In addition, people can, and do often fundamentally change their natural environments. Often, whether they realize it or not, bioregions provide the basis for inhabitant cultures, identities that stem from the place, that have the ability to help determine or shape these boundaries.
Things to Think About
- Name & Symbols: What is the name of the bioregion being mapped? If unsure, are there any good names for the region that are generally used? How about First Nation or Indigenous names for the area already in use? What are some distinct natural features or creatures that help define the distinct bioregion?
- Determining Boundaries: Hopefully using this sheet, coherent natural and cultural boundaries will emerge which will help provide a bioregional framework for the area. Bioregional maps are living documents. They change over time and are creating using many layers together. As a general rule though – bioregions tend to start at the jagged, hard lines found in nature.
- Determining Useful Layers: Together, layers of information, ecological, cultural, economic and political, all come together to help form what a bioregion is all about. These layers create a ‘bioregional atlas’.
Potential Layers
“The Hard Lines”
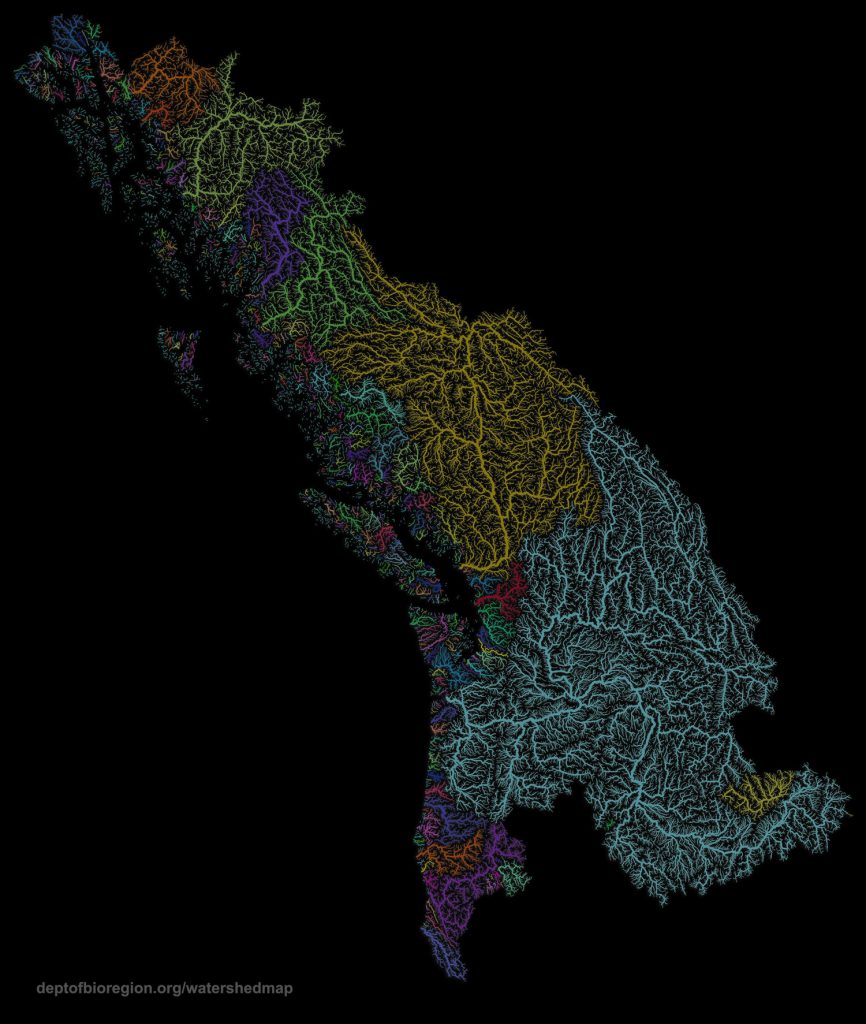
- Hydrology
- Drainage Basins
- Watersheds
- Water Tables
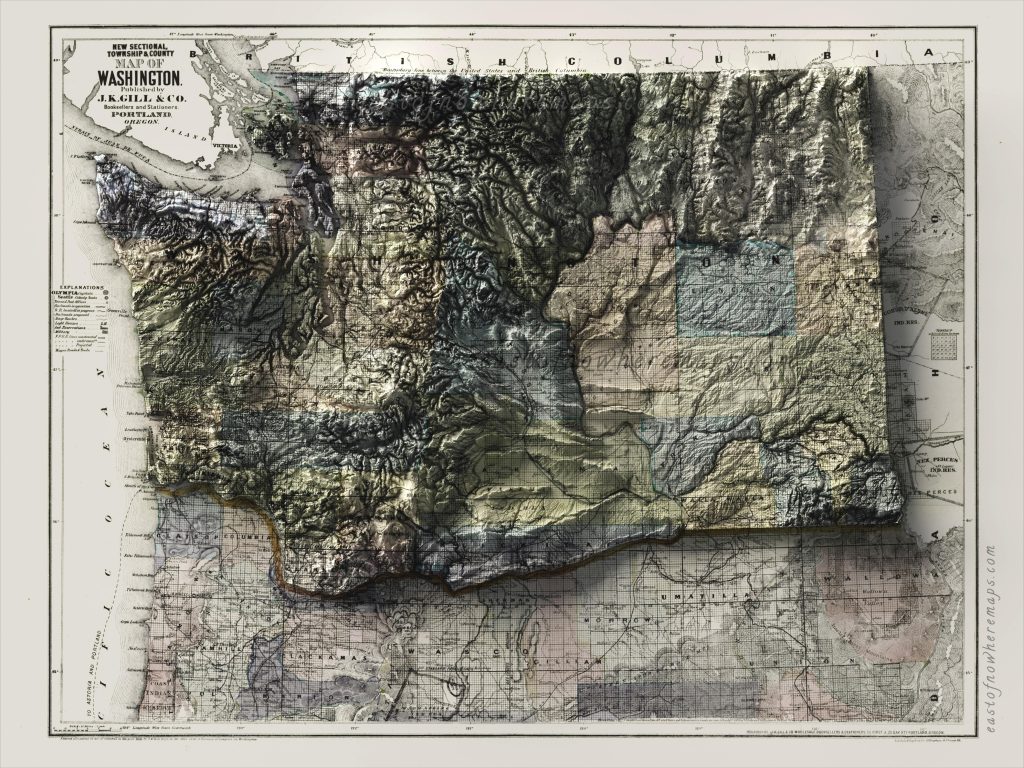
- Geology:
- Volcanoes / Mountains / Ridges / High Points
- Subduction Zones / Fault Lines / Plate Tectonics
- Soil Types http://www.bonap.org/2008_Soil/SoilTypesRelatedMaps.html
- Elevation Maps
- Climatology
- Weather Patterns / Wind Maps
- Climate Types
- Ocean Currents
- Water Precipitation
- Satellite Pictures in Day / in Night
“The Soft Lines”
- Ecology
- Ecosystems
- Ecoregions
- Plants, Trees, Animals
- Microbes / living matter
- Organic materials and matters
“The Cultural Lens”
- Indigenous Boundaries
- Place Appropriate / Indigenous and Traditional Ways of Living / Technologies
- Place Appropriate / Native Foods & Agriculture, Plants (and Ecosystems)
- Indigenous History and Culture
- Colonial History and Culture
- Language groups pre-colonial and post-colonial and Cultural Distinctions and Uniquenesses
Human Geography:
- Agriculture – Types, Eating Habits, Where does food come from?
- Energy Production
- Water and Waste Streams
- Disaster Preparedness & Resilience Networks
- Megaregions
- Transportation Connections
- Economic Connections
- Metro-Regions and Cities
- How does money travel / connect
- Communities & Identities
- Material Culture: Clothing, Fashion, Tools
- Regional Food, Drink, Music, Sports
Altered Landscapes
- Changes to hydrology, ecosystems or natural environments which affects all inhabitants downstream or in a larger surrounding area.
Mapping Bioregions:


Bioregional maps differ from traditional cartographic documents in several ways:
- The maps are made in the community by community members. The visual language of mapping is relearned, and becomes as important as speech or reading as a tool of communication. Maps made by governments or business interests will describe the world from their perspective only. Bioregional maps allow a community to describe itself from its own perspective.
- The maps combine scientific and traditional knowledge, with each type of information given equal respect and representation. Bioregional maps can only be made if a community assembles both a library of scientific reports, and a record of local knowledge, such as recordings, videos, essays and ethnographic surveys.
- Maps are made which equitably depict biophysical and cultural information. Traditional planning maps are reasonably good at showing information about the physical environment. Bioregional maps also add information and stories about the people who inhabit the land. Spatial information shows the location of things or events on the land, and descriptive information tells stories about what happened in a particular location. The map tells a story, in both written and visual formats.
- The maps are living documents, changed or created as new information is collected. As the bioregional maps are presented to community members, government agencies, business interests, and the general public, many new sources of information will be revealed. Because the maps are made in the community they can be revised simply and in a short period of time.
- Bioregional mapping is consistent with indigenous mapping and worldview. It can be employed as a means of empowerment, resistance and assertion of alternative perceptions of power. It can also bridge with contemporary western planning tools and GIS technologies.
Bioregional maps can be made in three ways.
- They can be made by hand using simple and inexpensive tools and large-format xerography. Tracing paper is used to copy a base map image from existing topographic maps.
- They can be made using digital software.
- They can be made using GIS (geographic information system) software. GIS software requires that a digital map of a particular territory be imported from a CAD or other cartography software.
A base map is created, with custom made title block, north arrow, and linear scale. This is a time to have some fun. The design of the base map is totally up to the community. The map can have a decorative border, a north arrow that uses a animal or other totem symbol, and can be otherwise customised to represent community identity.
The community can ask itself – what are important themes, stories, or messages they want to communicate? What are plants, animals or creatures that make the area special? What are things happening that are negatively or positively impacting the quality of life in the area? A simple place to start can even be starting with the necessities of modern life, that may help people better connect in with their place of living – such as where does the water come from? or the trash go? Who were the original inhabitants of an area… and what rivers, or streams do we live in? What are important stories or histories that are at risk of being erased, or who’s voices they want to amplify?
Scientific and local information is then collected, read, and summarised for inclusion on a series of biophysical or cultural maps. Biophysical maps include geology, soils, hydrology, physiography, flora, fauna, and various levels of ecosystem association. Cultural maps include tradition use, colonization, land ownership patterns, education levels, income levels, and administrative boundaries. Bioregional maps have been made on nearly 100 topics. It is up to a community to decide how it will best describe itself.
Information is then placed on each map image in two ways. Where things are located or where events occurred – spatial information – is shown. Second, descriptive information, the “story” of particular occurrence or location, is told in written or graphic form. By tying spatial and descriptive information together, the map reader saves the time of having to read often technical reports to know what story a map is telling. A third and compelling element can be the passage of time. How do things change with the seasons?
Once the bioregional map atlas is completed it becomes the common foundation of knowledge from which planning scenarios can be prepared, and decisions ultimately made. Complex information that is otherwise difficult to present is clearly depicted. The community learns about itself in the process of making decisions about its future. As information is collected – communities can also create bioregional atlases that communicate many different layers.
While many maps are bioregional maps, not all bioregional maps are bioregions. A bioregion is smaller than a continent but larger than an ecoregion. They should be large enough to be self reliant, share interconnected physical geography and inhabitant cultures, and ultimately will be defined by the people living there, even if this does not perfectly match the ecologic realities.
The ultimate purpose of defining bioregions, is to create ecological nations that can use these shared frameworks to create regenerative cultures and economies, and ways of governing that are better representative of people, place and inhabitant.
To map a bioregion, we use
- Geology / Plate Tectonics as our base maps. What are the hard lines? The subduction zones, underwater hydrology, Bioregions are defined through geology. They have hard, jagged lines. They are tectonic, faultlines, geology and whose shapes help conform the ecoregions and biotic life within them. We use bioregions as our frameworks for administrative units because ultimately, nature acts bioregionally. We cannot have any conversation about water, forest fires, drought, salmon recovery or other issues, without involving an entire watershed, and an entire bioregion.
- For internal boundaries we use ecoregions, and groupings of ecoregions if it makes sense to, defined through flora, fauna, topology, rainfall, history (indigenous cultures, histories, language groups – and settler culture, histories, dialects, historical regions etc), agriculture, energy production, urban / rural settings, roads, forests / land use. economic connections, sports, megaregions / intra economic connection – can all play into it.
- Lastly, we can include human inhabitation, and lines as they exist.
Bioregions are similar, but different from ecoregions, in that while being defined by natural borders and features, inhabitant cultures, and especially humans also impact their scale and definition. Ultimately it will be the people living in a place who will define it. For example ‘Pacific Northwest’ is a regional identity that is synonymous with Cascadian values.
Scales of Bioregional Mapping.

- Planet – Earth
- Continent – Defined through the continental crust. Antartica, North America, South America, Africa, Europe, Asia and Australia.
- Terra Region [1] – Used to refer to a collection of one or more bioregions defined by the largest scale of their watersheds, from the start of where a raindrop hits to it’s journey to it’s ultimate terminus. One example is be the watersheds of the Missouri / Mississippi drainage basin, which is so large that it will contain many natural groupings of cultural bioregions and nations. The Cascadia Bioregion, which is both a terraregion and bioregion has both shared culture and is made up of the physical boundaries. The Hawaii Island chain, even though it is comprised of many different watersheds, ecoregions and islands, is considered a bioregion and terraregion because has a shared culture and history within it.Despite these differences, as long as commonalities such as watershed and environment are shared, there must be at least some form of administrative framework in place for equitable use of commonly shared resources and waterway commons.
- Bioregion – Natural countries of the planet. They are defined by 1) starting with the geology + tectonics – and then 2) the systems that emerge from hydrology and rainfall, i.e. watersheds. Soil types. 3) Biotic flora, flauna. Human inhabitation and culture, and how they have altered their lived in. Bioregions can be standalone watershed provinces such as Hawaii or Cascadia, or a Watershed Province might include several bioregions, such as Laurentia, Hudson Bay or Mississippi / Missouri.
- Biotic Provinces – Shared regions of culture, flora and fauna that stem across more than a single ecoregion. Food sheds, fiber sheds, fire sheds. Floodplains are all examples.
- Ecoregions – Shared watersheds of a drainage area with similar types of flora and fauna.
- Watershed Municipalities – Watershed districts within an Ecoregion, either individually, or that combined make up various cities and other major features within ecoregions.
- City Municipalities – Greater city areas and rural areas within a watershed.
- Neighborhood / Community – exist within city or watershed municipalities.
Bioregional scales can be used as a framework to measure success and failure of sustainability and carbon neutrality. How much a bioregion can store, recycle, mitigate, and set natural limits for growth; meet the habitat requirements of keystone and indicator species; including human communities and the development of place appropriate technologies and ways of living.[/vc_column_text][/vc_column][vc_column width=”1/4″][vc_single_image image=”1614″ img_size=”medium” add_caption=”yes” alignment=”center”][vc_separator][vc_column_text]Additional Notes:
- Bioregional maps remove arbitrary political boundaries. This can be a layer, but should not be a base map or layer.
- The name of the bioregion should be an “endonym” which means the name for a place, site or location in the language of the people who live there. It should be representative of the whole region, not one particular point, or place or people.
- If you’re interested in generating a bioregional flag – simply create a flag that depicts a direct representation of the landscape, with an icon that helps represent the bioregion or what it represents. This lets the cultural human elements be adaptable for different causes and communities, and the colors to be adaptable for different subregions and geographic representations & color branding.
[/vc_column_text][vc_separator][vc_column_text]
Some defining features of bioregional maps:
- Every person is an expert, and has something valuable to contribute, to document to share. This can include narratives, histories, stories, things people find special, or knowledge relating to place. Bioregional maps are generally created or defined by communities living within or affected by the topic of the map.
- Temporal. Bioregional maps often include time. How a place changes or is different in each season, or from one year to the next. How animals, glaciers or fish migrate or move. In addition it can map past, present and future – and create roadmaps to societies or things we want to build.
- Bioregional maps can use a wide array of methods to convey information, including song, dance, stories, sign languages, music, social mapping, cognitive mapping, and many other means that individuals feel best able to represent information.
- Many indigenous forms of mapping are inherently bioregional forms of mapping. This includes family and clan relationships, traditional territories and boundaries, relational maps such as to bodies of water, stars and sky.
- As a rule, if you see straight lines on a map, whether it is dividing a continent (Africa, Australia etc.), a community (US political districts, gerrymandering), roads (Google Maps) it is not a bioregional map.
Bioregional maps use ‘layers’ that together can better represent a place. These can include:
- Physical: Geology, tectonics, subduction zones, mountains, peaks, ridges, valleys, rainfall, wind patterns, and how they change over time.
- Biotic: Plants, animals, soils. Growing conditions. How animals and plant nations within an area interrelate, and how they change over time.
- Human: Lessons of living in place, indigenous ways of living and knowledge. Culture, economy, politics. agriculture, energy. History, the context and understanding of past and present, and visions for the future that can serve as roadmaps for how we can get to the future.
When possible we set the biotic and temporal elements (x axis) within the physical reality of place (y axis) and document how it flows with the passing of time (z axis).
Bioregional maps are not made from one layer of information, but rather atlases in which layer upon layer has been added, from which shapes and deeper lessons emerge.
[/vc_column_text][/vc_column][/vc_row]